 Image 1 of 1
Related Standards:
MLS: 5.NF.A.3 4.NF.C.9 4.NF.C.10 3.NF.A
CCSS: 5.NBT.A.3 4.NF.C.6 3.NF.A.1
Format: PDF
Pages: 1
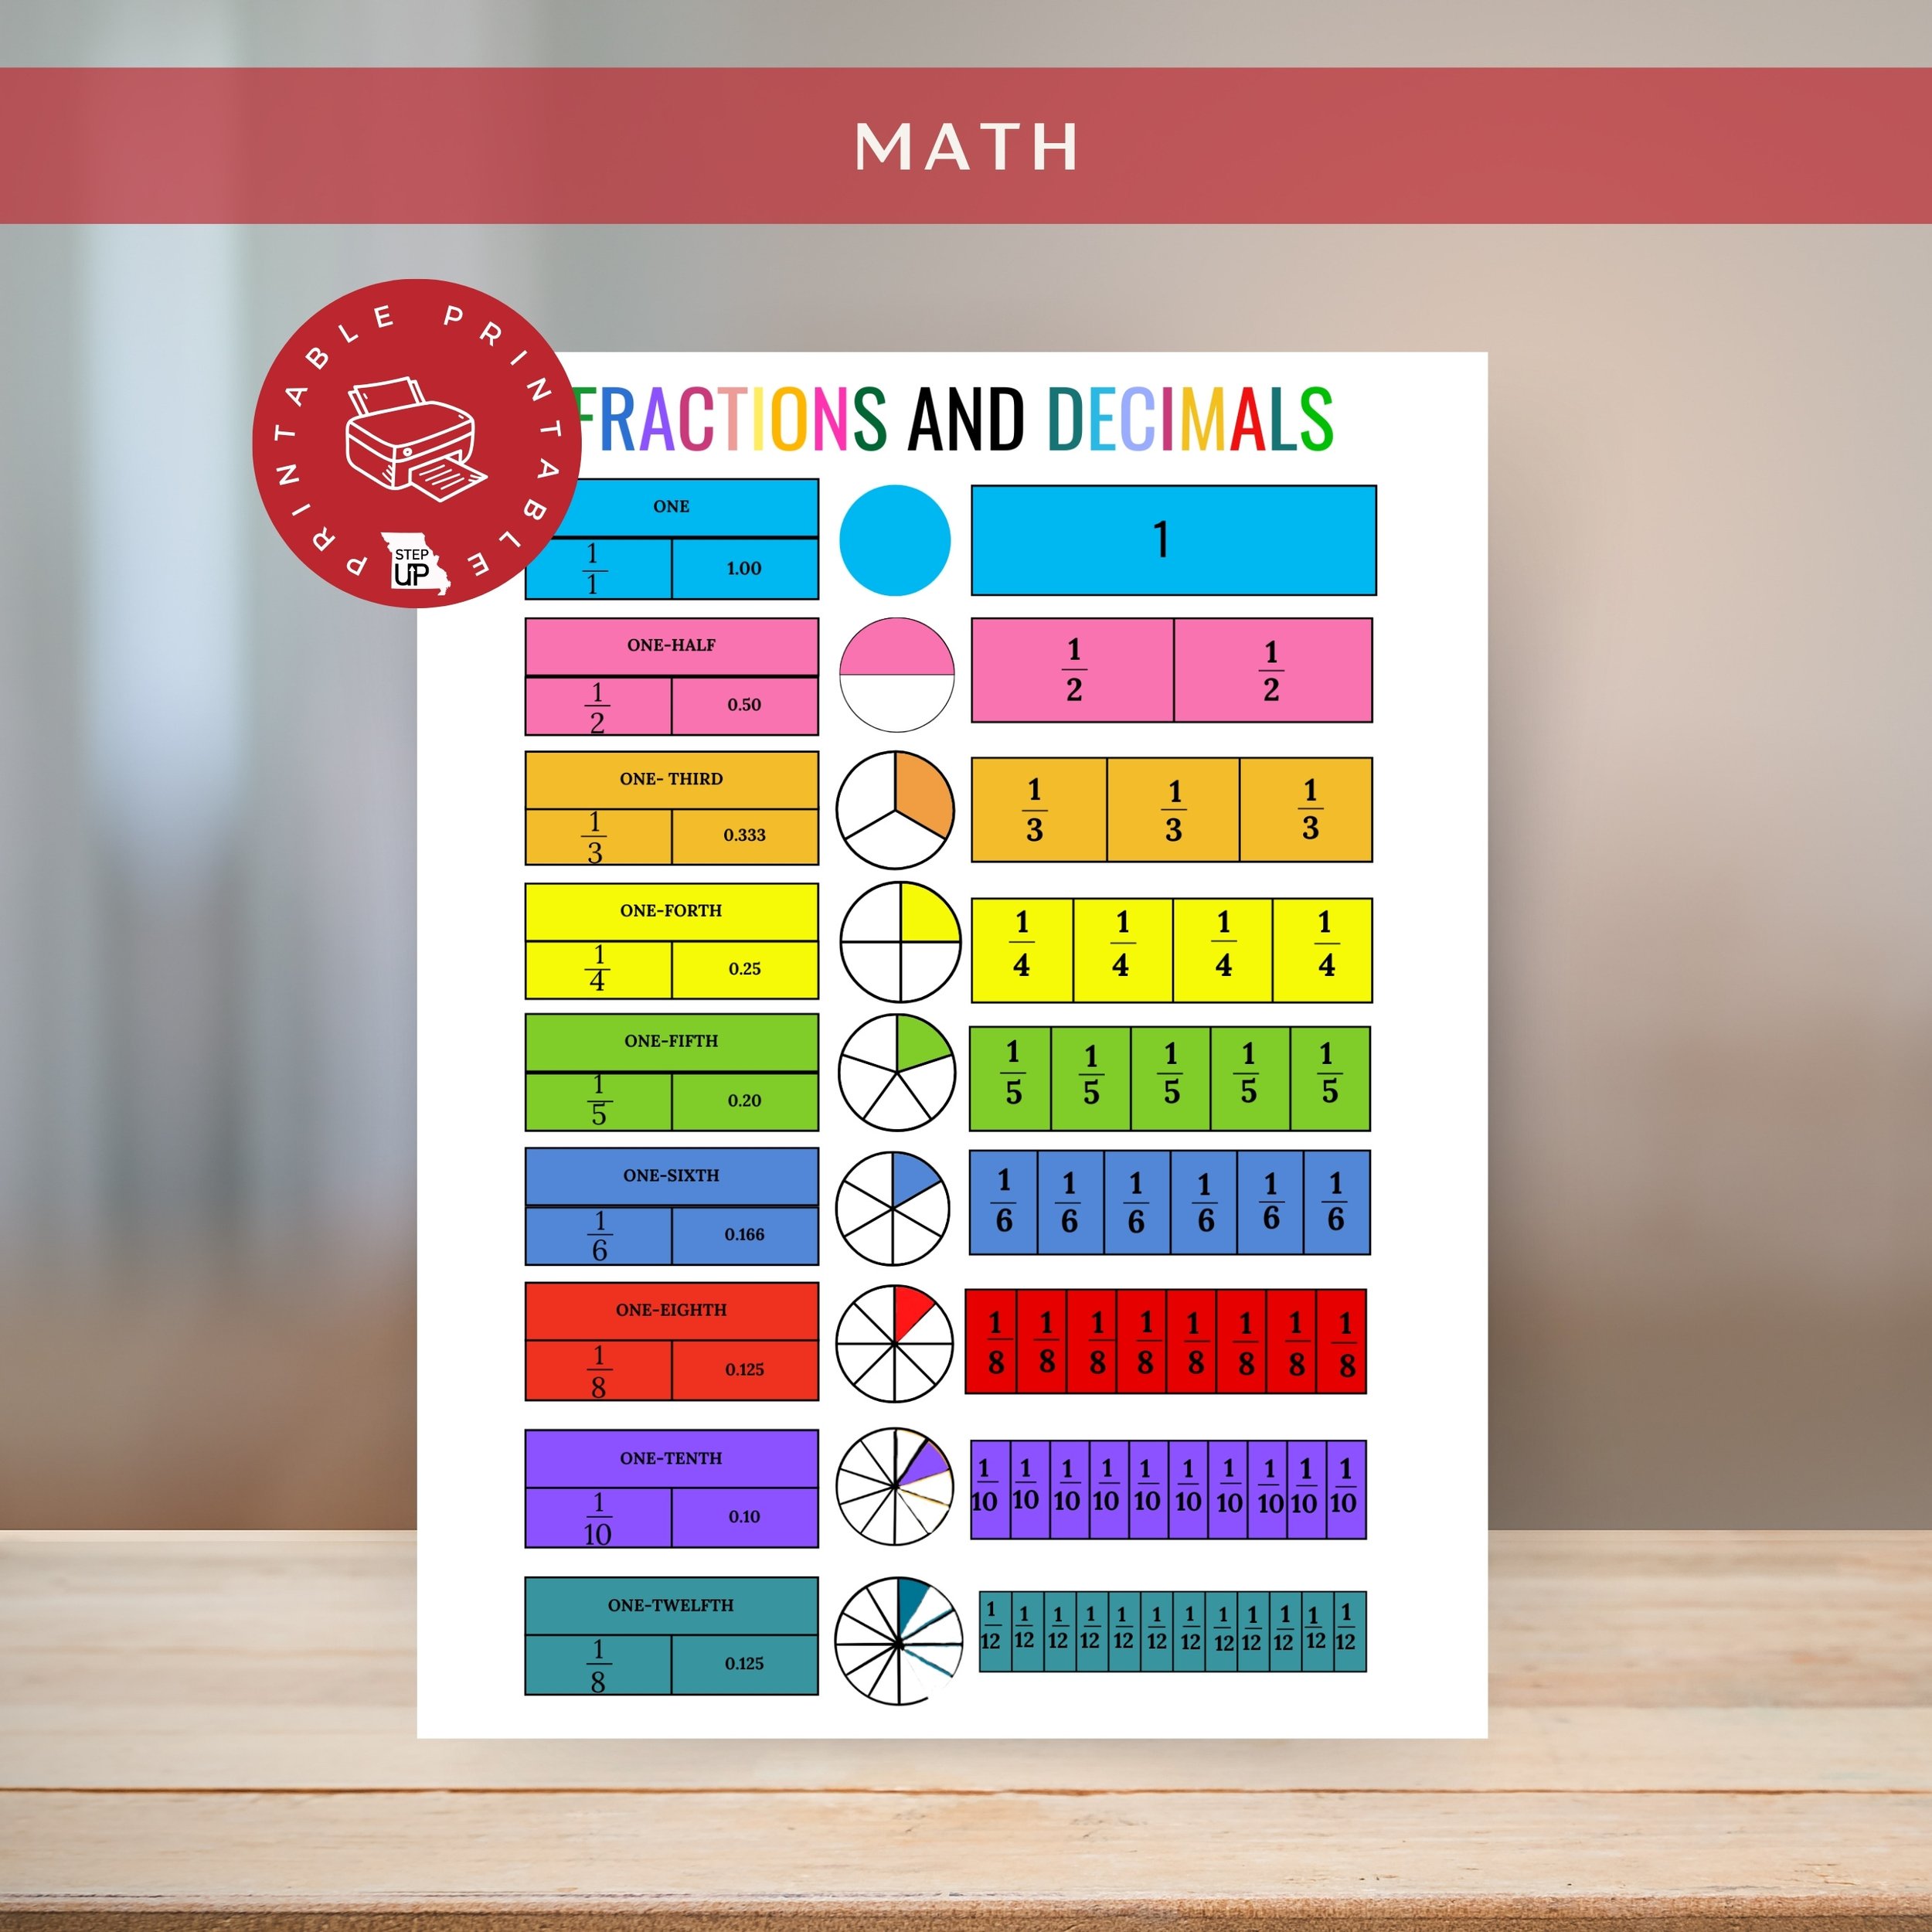
Mastering the relationship between fractions and decimals is a cornerstone of middle-elementary math. This colorful educational graphic provides a clear, side-by-side comparison to help students visualize how these two concepts relate to the same whole.
By using visual math models, this resource transforms abstract numbers into concrete concepts, making it an essential tool for 4th grade and 5th grade math instruction.
Key Features for Conceptual Understanding:
Bar Models (Fraction Bars): Provides a linear representation of parts of a whole, perfect for understanding decimal place value.
Pie Graphs (Area Models): Uses circular graphs to show "slices" of a whole, helping students visualize percentages and portions.
Color-Coded Equivalencies: Matching colors across bars and circles help students instantly spot the connection between fractions (like $1/4$) and their decimal counterparts ($0.25$).
Clear Labeling: Designed to reduce math anxiety by presenting information in a clean, uncluttered layout.
Why This Math Resource Works:
Supports Differentiated Instruction: Ideal for visual learners and students receiving math intervention (RTI).
Classroom Ready: Use it as a math anchor chart, a reference sheet for interactive notebooks, or a digital slide for your daily lesson.
Aligned to Standards: Supports Common Core standards for Number & Operations (Fractions and Decimals).
Boosts Number Sense: Encourages students to move beyond rote memorization toward a deep, visual understanding of rational numbers.
Make fractions to decimals conversion easy and engaging with this essential visual learning tool!
Once purchased, you will be directed to an immediate download.
Format: PDF
Pages: 1
Mastering the relationship between fractions and decimals is a cornerstone of middle-elementary math. This colorful educational graphic provides a clear, side-by-side comparison to help students visualize how these two concepts relate to the same whole.
By using visual math models, this resource transforms abstract numbers into concrete concepts, making it an essential tool for 4th grade and 5th grade math instruction.
Key Features for Conceptual Understanding:
Bar Models (Fraction Bars): Provides a linear representation of parts of a whole, perfect for understanding decimal place value.
Pie Graphs (Area Models): Uses circular graphs to show "slices" of a whole, helping students visualize percentages and portions.
Color-Coded Equivalencies: Matching colors across bars and circles help students instantly spot the connection between fractions (like $1/4$) and their decimal counterparts ($0.25$).
Clear Labeling: Designed to reduce math anxiety by presenting information in a clean, uncluttered layout.
Why This Math Resource Works:
Supports Differentiated Instruction: Ideal for visual learners and students receiving math intervention (RTI).
Classroom Ready: Use it as a math anchor chart, a reference sheet for interactive notebooks, or a digital slide for your daily lesson.
Aligned to Standards: Supports Common Core standards for Number & Operations (Fractions and Decimals).
Boosts Number Sense: Encourages students to move beyond rote memorization toward a deep, visual understanding of rational numbers.
Make fractions to decimals conversion easy and engaging with this essential visual learning tool!
Once purchased, you will be directed to an immediate download.
MLS: 5.NF.A.3 4.NF.C.9 4.NF.C.10 3.NF.A
CCSS: 5.NBT.A.3 4.NF.C.6 3.NF.A.1