Format: PDF
Pages: 1
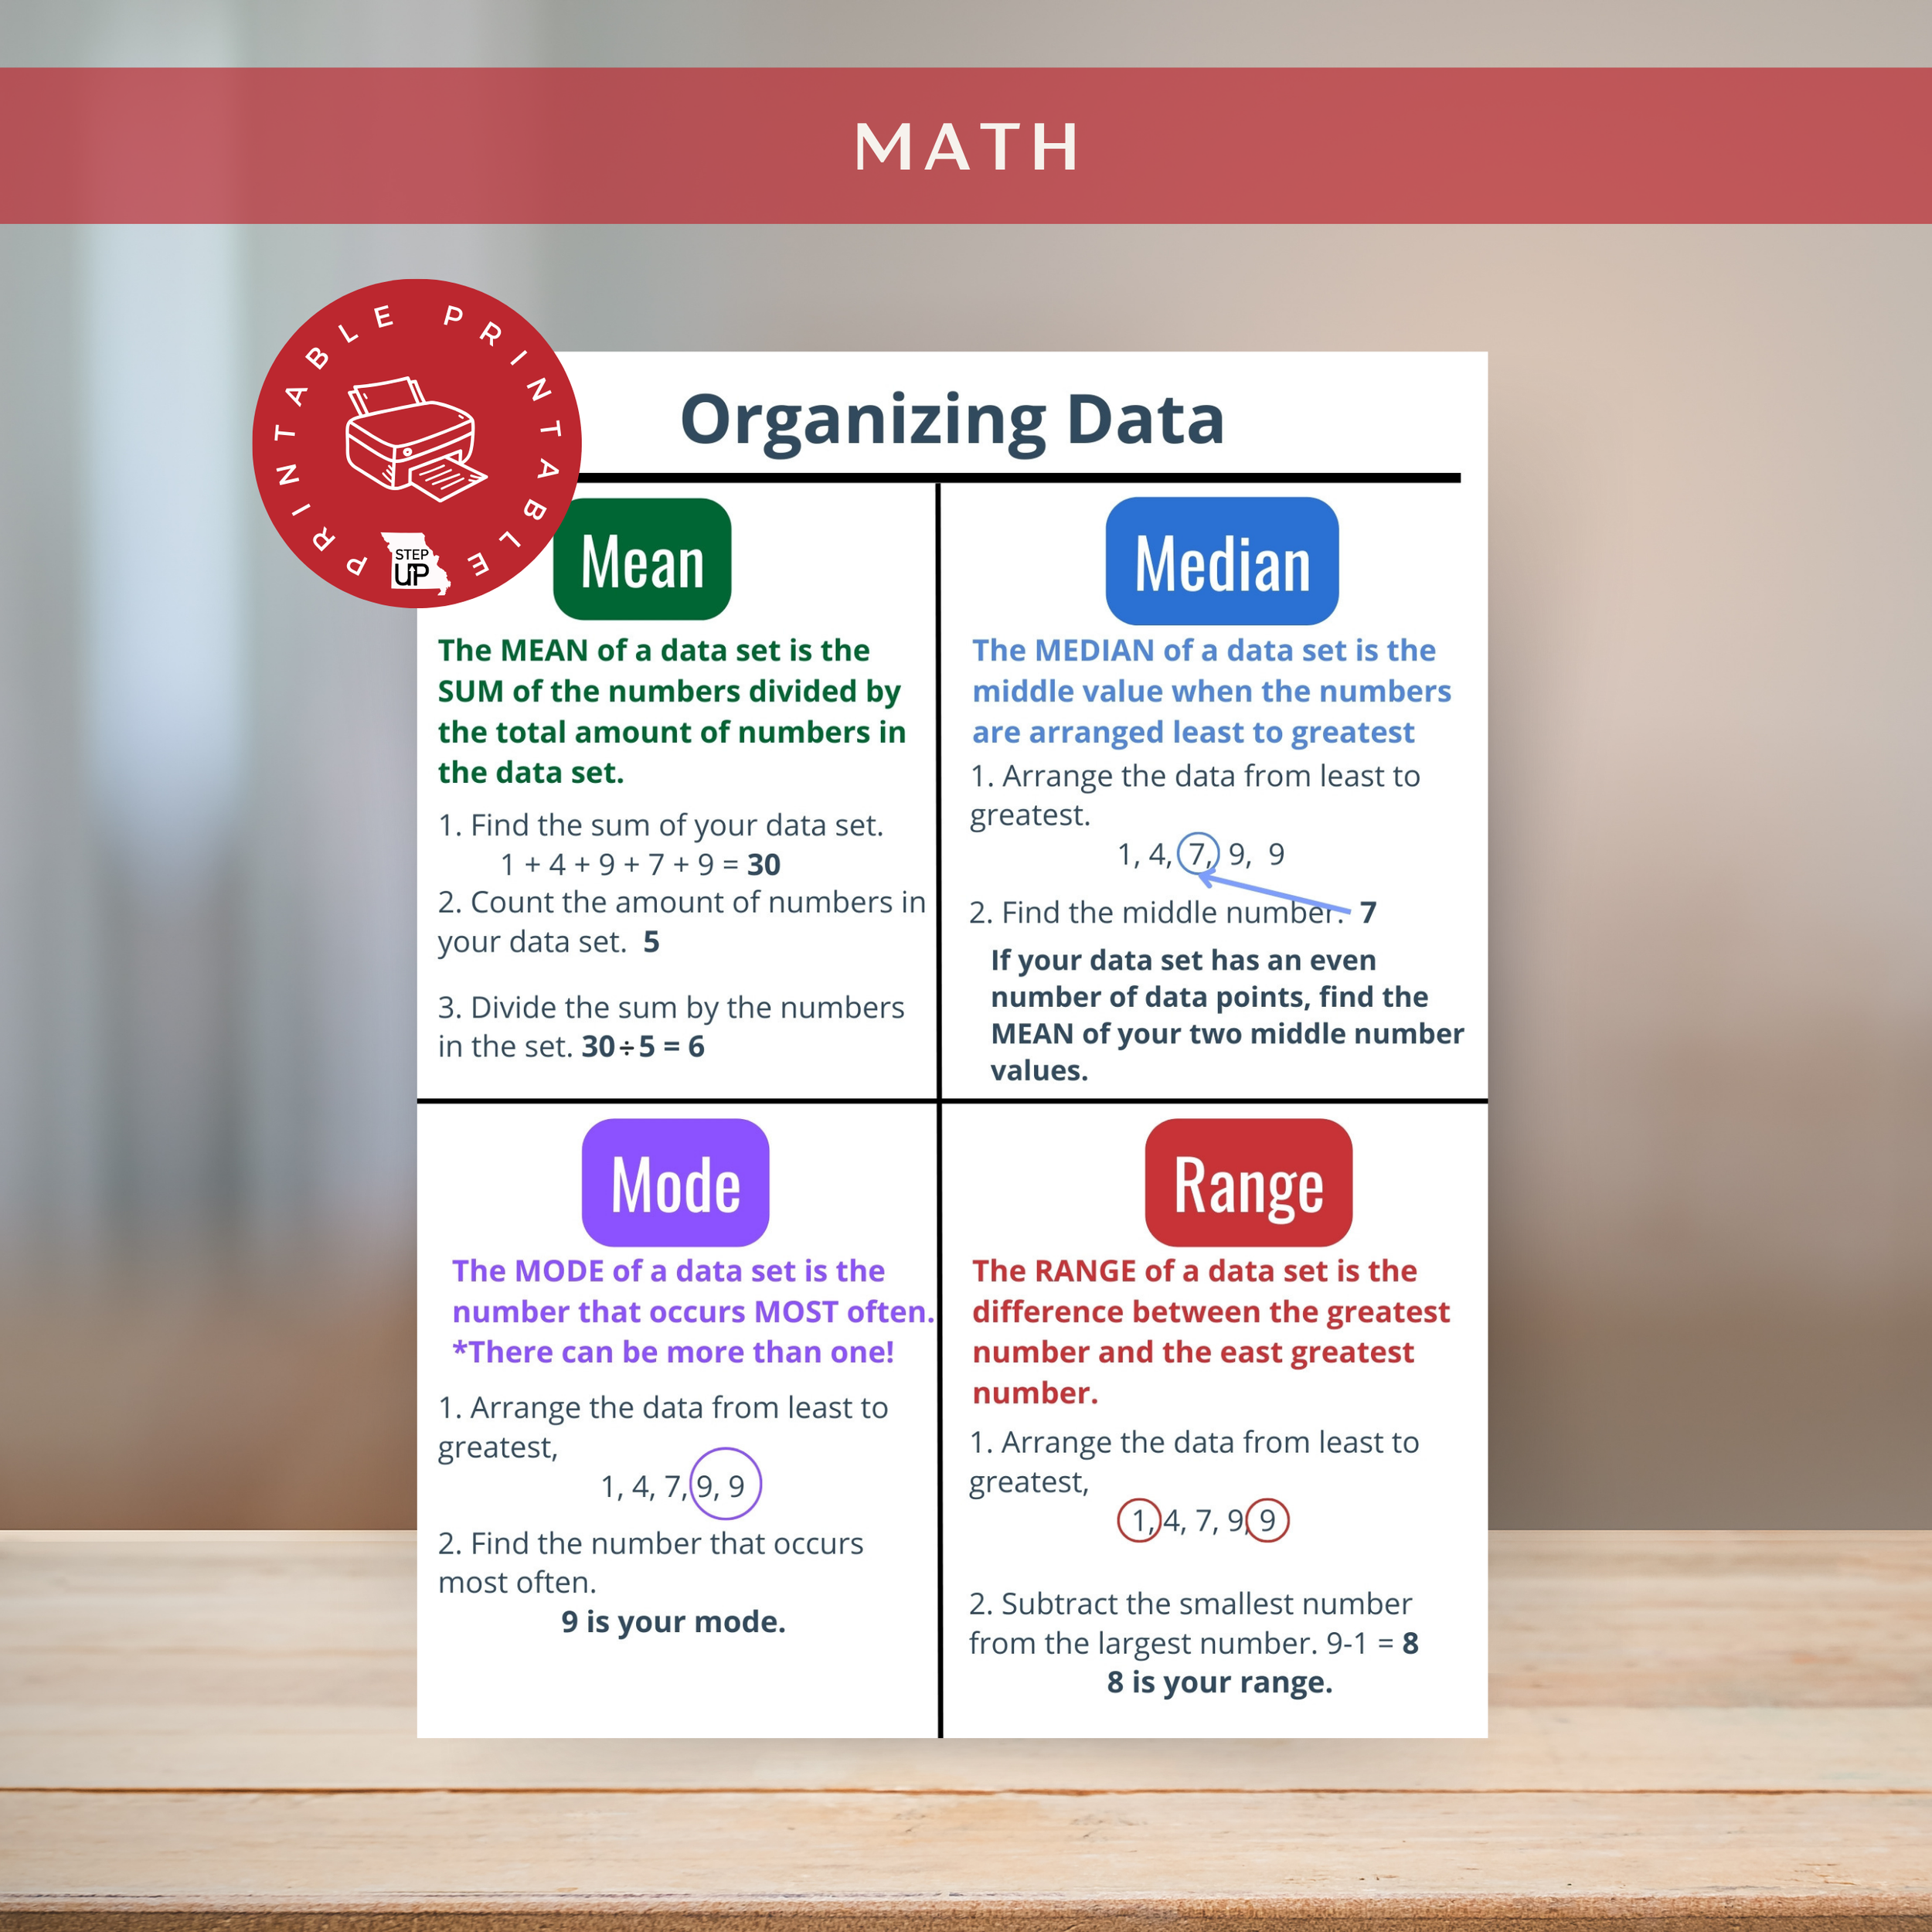
This graphic provides a clear, step-by-step guide for finding the mean, median, mode, and range of a data set. It explains each concept with simple definitions and examples, helping students easily understand how to calculate these key statistical measures. Perfect for math lessons or study aids, this resource makes learning statistics engaging and accessible!
Once purchased, you will be directed to an immediate download.
Format: PDF
Pages: 1
This graphic provides a clear, step-by-step guide for finding the mean, median, mode, and range of a data set. It explains each concept with simple definitions and examples, helping students easily understand how to calculate these key statistical measures. Perfect for math lessons or study aids, this resource makes learning statistics engaging and accessible!
Once purchased, you will be directed to an immediate download.
MLS: 4.DS.A.3
CCSS: